Understanding Risk Contours and LSIR
Those colorful lines on your site map aren't just art. They define your legal liability. We explain Risk Contours, LSIR, and the famous '1 in a million' line.
Understanding Risk Contours and LSIR
TL;DR Summary (AI Quick Reference): Risk contours (like the critical 1×10⁻⁶ line) map out where major hazard risks are high, acceptable, or intolerable around a facility. In South Africa, SANS 1461 dictates that if the 1×10⁻⁶ contour extends into unprotected public areas, you face severe legal liabilities and operate as a Major Hazard Installation (MHI). Seasonal weather variations (e.g., prevailing March winds or heavy Autumn rains) significantly alter how these contours spread, making localized QRA modeling essential.
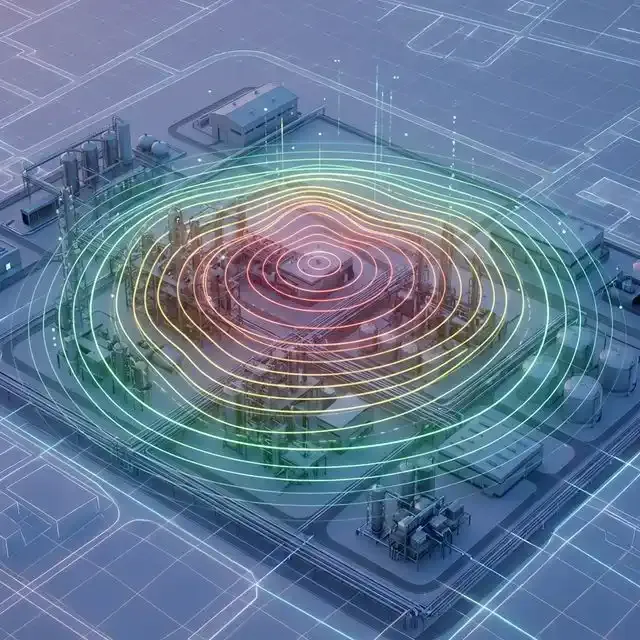
Most QRA reports have a coloured map with loops around your site. Those loops are risk contours and they show where the risk is high, low, or acceptable.
In this article we explain, in plain language:
- What risk contours and LSIR actually mean.
- The key numerical levels used in SANS 1461 and international practice.
- How these lines affect land use and compliance in South Africa.
- March Trend Alert: How changing seasonal weather patterns actively warp your risk contours.
- Real-world examples from SA facilities.
- What to do if your contours extend too far.
What is a Risk Contour?
A risk contour connects points of equal risk. It works exactly like an elevation contour on a hiking map.
- On a hiking map, every point on the 100 m line is 100 m above sea level.
- On a risk map, every point on the 1×10⁻⁶ line has a 1 in 1 000 000 chance of fatality per year.
Crucial Definition: It represents Individual Risk. It assumes a hypothetical person is standing at that specific spot, unprotected, 24 hours a day, 365 days a year.How Contours Are Generated
Risk contours are the output of a Quantitative Risk Analysis (QRA). The process involves:
- Hazard identification – what can go wrong?
- Consequence modelling – how bad is each scenario? (See Consequence Modeling Explained)
- Meteorological Integration – Seasonal shifts (like heavy Autumn rains or changing wind roses in March) drastically affect gas dispersion and pool fire characteristics. What looks safe in summer might be a hazard in spring.
- Frequency analysis – how often does each scenario occur?
- Risk integration – combine all scenarios to produce cumulative risk at every point on the map.
The result is a set of contour lines overlaid on your site plan, typically colour-coded:
Contour Colour (typical) Meaning 1×10⁻⁴ Red Intolerable for public 1×10⁻⁵ Orange ALARP region 1×10⁻⁶ Yellow Public boundary 3×10⁻⁷ Green Vulnerable populations The Magic Numbers: South African Risk Criteria
In South Africa, SANS 1461:2018 and the MHI Regulations 2022 give specific meaning to these values. These align closely with international practice (UK HSE, Dutch RIVM).
1×10⁻⁴ (1 in 10 000 per year) – INTOLERABLE
- Inside this line: Risk is considered intolerable for the general public.
- Implication: No residential areas, schools, hospitals, or shopping centres should be inside this contour.
- Workers: Even industrial workers need strict protection (engineering controls, PPE, limited occupancy).
1×10⁻⁵ (1 in 100 000 per year) – ALARP BOUNDARY
- Between 10⁻⁴ and 10⁻⁵: Risk is in the ALARP region for workers.
- Implication: Risk must be reduced unless the cost is grossly disproportionate to the benefit.
- Land use: Light industrial or commercial use may be acceptable with appropriate controls.
1×10⁻⁶ (1 in 1 000 000 per year) – PUBLIC BOUNDARY
- The Significance: This is the globally accepted standard for "safe" public exposure.
- Outside this line: Risk is considered broadly acceptable for the general public.
- Land Use: If this line extends off your property into a residential area, you have a problem. You are likely classified as an MHI. (See MHI vs Non-MHI for more on classification.)
3×10⁻⁷ (3 in 10 000 000 per year) – VULNERABLE POPULATIONS
- Used for: Hospitals, schools, old age homes, crèches.
- Implication: These sensitive receptors should be outside the 3×10⁻⁷ contour.
- SA Context: Particularly important given the proximity of informal settlements to industrial areas.
LSIR: Location Specific Individual Risk
You will often see the term LSIR in QRA reports.
LSIR is simply the technical term for the risk shown by these contours. It is "Location Specific" because it depends entirely on where you are standing relative to the hazard.LSIR Example
Consider a chlorine storage facility:
Location Distance from Tank LSIR (per year) Risk Level Next to tank 10 m 1×10⁻³ Intolerable Control room 50 m 5×10⁻⁵ ALARP Admin building 150 m 1×10⁻⁵ ALARP boundary Fence line 300 m 1×10⁻⁶ Public boundary Nearest house 500 m 3×10⁻⁷ Broadly acceptable IRPA: Individual Risk Per Annum
IRPA is a related concept that accounts for actual occupancy. While LSIR assumes 24/7 presence, IRPA adjusts for the fraction of time a person actually spends at that location.
Example:
- LSIR at control room = 5×10⁻⁵
- Operator works 8-hour shifts, 250 days/year = 23% occupancy
- IRPA = 5×10⁻⁵ × 0.23 = 1.15×10⁻⁵
IRPA is often used for worker risk assessment, while LSIR is used for land-use planning.
Societal Risk: The F-N Curve
LSIR looks at an individual. But what if a single accident kills many people?
That is Societal Risk. We plot this on an F-N Curve:
- F (Frequency): How often accidents causing N or more fatalities occur.
- N (Number): Number of fatalities.
F-N Curve Criteria
Region Meaning Action Above upper line Intolerable Risk must be reduced regardless of cost Between lines ALARP Reduce risk unless cost is grossly disproportionate Below lower line Broadly acceptable No further action required When Societal Risk Matters
Societal risk is particularly important when:
- Your facility is near dense populations (townships, informal settlements).
- A single accident could cause multiple fatalities (e.g., toxic cloud over a school).
- You are applying for new development approval near existing communities.
SA Context
South Africa's rapid urbanisation means many MHIs now have communities much closer than when they were originally built. F-N curves help quantify whether this encroachment has pushed societal risk into the intolerable region.
Real-World SA Examples
Example 1: LPG Depot in Gauteng
Facility: 500-tonne LPG storage depot in an industrial area south of Johannesburg.
QRA Findings:
- 1×10⁻⁶ contour extends 450 m from the centre of the depot.
- Nearest residential area is 380 m away.
- Result: The 10⁻⁶ contour extends into the residential area by 70 m.
Implications:- Facility is classified as an MHI.
- Must notify Department of Employment and Labour.
- Options: reduce inventory, add safeguards, or negotiate land-use restrictions with municipality.
Example 2: Ammonia Cold Storage in KwaZulu-Natal
Facility: 80-tonne ammonia refrigeration system at a food processing plant.
QRA Findings:
- 1×10⁻⁶ contour extends 280 m from the ammonia storage.
- Nearest school is 350 m away.
- Result: School is outside the 10⁻⁶ contour but inside the 3×10⁻⁷ contour.
Implications:- Facility may not be classified as MHI (depending on aggregation with other substances).
- However, the proximity of a vulnerable receptor (school) requires careful consideration.
- Recommendation: install additional gas detection and emergency shutdown systems.
Example 3: Fuel Terminal in Western Cape
Facility: Multi-product fuel terminal with 50 000 m³ storage capacity.
QRA Findings:
- 1×10⁻⁶ contour extends 600 m from the tank farm.
- New housing development proposed 500 m away.
- Result: Proposed development is inside the 10⁻⁶ contour.
Implications:- Municipality should not approve the housing development in its current location.
- Developer options: relocate the development, or negotiate with the terminal to reduce risk.
- Terminal options: reduce inventory, install additional fire protection, or accept land-use restrictions.
What If Your Contours Extend Too Far?
If your risk contours extend further than they should (e.g., the 10⁻⁶ line hits a neighbour's house), you have several options:
Option 1: Reduce the Risk (Engineering)
Measure Effect on Contours Reduce inventory Smaller source term → smaller contours Install ESD valves Faster isolation → smaller release volume Add gas detection Earlier response → smaller consequence Install blast walls Reduced overpressure propagation Upgrade containment Smaller pool fires Typical cost: R100 000 – R5 000 000 depending on measure. Option 2: Land-Use Planning
If risk cannot be reduced sufficiently, the land use must be restricted:
- Negotiate with municipality to prevent incompatible development.
- Purchase buffer land to create a sterile zone.
- Establish servitudes that restrict future development.
SA Legal Framework:- Spatial Planning and Land Use Management Act (SPLUMA) – governs municipal planning.
- MHI Regulations 2022 – require notification of neighbours and local authority.
- Municipal by-laws – may include specific provisions for hazardous installations.
Option 3: Relocate
In extreme cases, relocation may be the only option:
- Relocate the hazard – move storage to a less populated area.
- Relocate the receptor – assist residents to move (rare, expensive, politically sensitive).
Risk Contours and Property Value
Risk contours have real financial implications:
Situation Impact Property inside 10⁻⁶ contour Reduced value; may be unsaleable for residential use New development blocked Lost development value (potentially R10 million+) Existing MHI with encroachment Potential liability; may need to fund risk reduction SA Case Study: A proposed shopping centre near an LPG depot in Gauteng was blocked by the municipality after a QRA showed the 10⁻⁶ contour extended into the proposed site. The developer lost an estimated R50 million in project value.
How to Read a Risk Contour Map
When reviewing a QRA report, check:
- Scale and orientation – ensure you understand the map scale and north direction.
- Contour values – identify which contours are shown (10⁻⁴, 10⁻⁵, 10⁻⁶, 3×10⁻⁷).
- Sensitive receptors – locate residential areas, schools, hospitals on the map.
- Fence line – does the 10⁻⁶ contour extend beyond your property boundary?
- Dominant contributors – which scenarios contribute most to the risk? (Usually shown in a separate table.)
Conclusion
Risk contours are the "final score" of your safety performance. They translate complex physics and statistics into a simple "Safe / Unsafe" boundary on a map.
Key takeaways:
- 1×10⁻⁶ is the critical boundary for public exposure.
- 3×10⁻⁷ applies to vulnerable populations (schools, hospitals).
- If your contours extend off-site, you need to act – reduce risk or manage land use.
- Risk contours have real financial and legal implications.
Do You Know Where Your 10⁻⁶ Line Falls?
If you don't, you might be unknowingly exposing your neighbours to unacceptable levels of risk – and exposing yourself to legal liability.
MMRisk uses industry-leading software (PHAST/Safeti) to model your contours accurately, taking local seasonal weather conditions and topography into account for a fully defensible report.
Typical QRA turnaround: 8–16 weeks depending on complexity.
Cost: R150 000 – R1 500 000+ depending on facility size.
[!IMPORTANT]
Don't risk false negatives. Learn about our advanced SANS 1461 MHI Assessment and QRA Services to get a legally defensible view of your facility's risk contours.
Contact us for a risk modelling consultation.